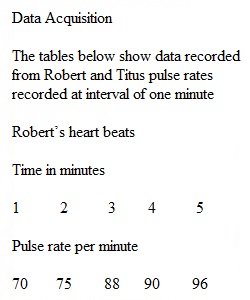
Q Getting Ready for A&P: Data Acquisition and Data Graphing • Points 10 • Submitting a text entry box or a file upload Assignment Instructions Step 1: Data Acquisition Perform the following activity, preferably with a partner. You will determine resting heart (pulse) rate, measured in beats per minute (bpm). *If you are alone, you may perform this experiment on yourself, but the results will not be as accurate. SAFETY FIRST! PREVIEW and make sure you UNDERSTAND the instructions carefully before performing any test. If you are unsure about how to perform a test, or uncomfortable for any reason before or during a test, IMMEDIATELY STOP and ask the professor for help. Do not perform any tests other than those explained here. 1. Wash your hands before palpating your partner's pulse. Make sure your partner has rested for at least 5 minutes in a seated position. 2. Lightly place your index and middle finger on the skin over the radial artery on the subject’s non-dominant hand. Increase the pressure slightly until you feel the pulse. Do not press too hard (or you could obliterate the pulse and cut off circulation in that artery). Do not use your thumb, as it has its own pulse. 3. Count the number of pulses in 60 seconds. Record the subject’s pulse measurement in beats per minute (bpm) in a table of your design in your notes. 4. Add to your notes any pulse fluctuations, patterns or strength changes during each pulse measurement. 5. Pause for at least 60 seconds between measurements. 6. Repeat steps 2-5 for a total of 5 pulse measurements for the subject. 7. Repeat steps 1-6 for the second subject. Your table should have measurements for 2 subjects*. 8. Upload your data table or create one in the textbox for this assignment. Step 2: Data Graphing Using the data recorded in Step 1, construct a line graph depicting the resting heart rate fluctuations in 2 subjects. Your graph may be hand-drawn or computer generated (i.e., via Microsoft Excel). Be sure to include labeled and numbered axes, and average values. You will be uploading your graph to this assignment. Step 3: Graphing Data, Interpolation, and Extrapolation 1. Read the following data information and view the data tables. 2. Using the data recorded in the tables, construct a line graph depicting the results from all 3 groups of subjects below. 3. Add the blood glucose concentration at 45 min. by interpolation to your graph. 4. Add the blood glucose concentration at 210 min. by extrapolation to your graph. 5. Upon completing, you will upload your graph to this assignment dropbox. Researchers hypothesized that exercise would help men with Type 2 diabetes mellitus improve their blood glucose metabolism. Twenty males with Type 2 diabetes mellitus and sedentary lifestyles were chosen to take a glucose tolerance test: Diabetic Men, No Exercise Time (minutes) 0 30 60 90 120 180 Blood Glucose (mg/dL) 130 210 260 250 230 170 Next, the researchers had the same diabetic men exercise regularly for 30 days, and repeated the glucose tolerance test, with the following averaged results: Diabetic Men, With Exercise Time (minutes) 0 30 60 90 120 180 Blood Glucose (mg/dL) 130 190 210 190 180 120 Data Acquisition and Data Graphing Criteria Ratings Pts This criterion is linked to a Learning OutcomeStep 1: Data Acquisition 3 pts Full Marks Data displayed in a clear and well constructed table. 2 pts Partial Marks Data table could use some work - talk to me if you need help! 1 pts Partial Marks Data entered, but not in tabular form. 0 pts No Marks No data or table. 3 pts This criterion is linked to a Learning OutcomeStep 2: Data Graphing 3 pts Full Marks Clear, well-constructed, and labeled graph. 2 pts Partial Marks Graph not clear or incomplete. It may just be your graphing skills are rusty. Talk to me if you need help! 1 pts Partial Marks Graph not complete - much is missing 0 pts No Marks No graph. 3 pts This criterion is linked to a Learning OutcomeStep 3: Graphing Data, Interpolation, and Extrapolation 4 pts Full Marks Clear, well-constructed, and labeled graph. Interpolation and extrapolation points clear and correct. 2 pts Partial Marks Graph is sufficient, but interpolation and extrapolation points are not clear and /or correct. 1 pts Partial Marks Graph is insufficient - interpolation and extrapolation points are missing. 0 pts No Marks No graph 4 pts Total Points: 10 Finally, the researchers performed the glucose tolerance test on a group of 20 normal men (those without Type 2 diabetes), with the following averaged results: Normal Men Time (minutes) 0 30 60 90 120 180 Blood Glucose (mg/dL) 80 120 110 90 90 80 What to Submit When you've completed steps 1-3, place all your work in the Text Entry box for this assignment, OR you may upload a separate document with your work to the assignment dropbox. Expectations To guide your work, the rubric at the bottom of this page will be used to grade this assignment. When you have completed the assignment, you can view my comments under Grades. Rubric Data Acquisition and Data Graphing
View Related Questions